Events
News & Updates
Posted By:
Lara McCormick
Friday 21 January 2011
Part One of the AIGA/NY: Data Visualization series (AIGA/NY:DVS) was held on Wednesday, January 12, 2011 at Tishman Auditorium. This event, moderated by Eddie Opara, offered a look at data visualization through three distinct lenses: the curatorial, the scholastic, and the professional.
The Curatorial
Kate Carmody, curatorial assistant in the architecture & design department, MoMA.
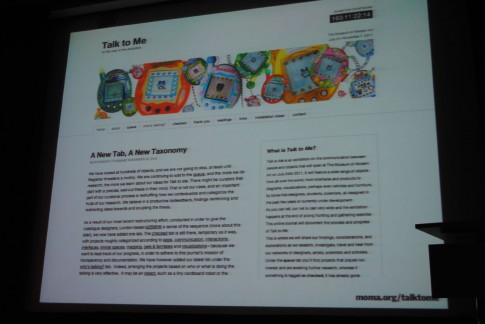
Kate is currently working with senior curator Paola Antonelli on Talk to Me, an exhibition on the communication between people and objects and how designers write the initial script that enables the two parties to communicate effectively and elegantly. The curatorial process is being documented in the exhibition’s on-line journal.
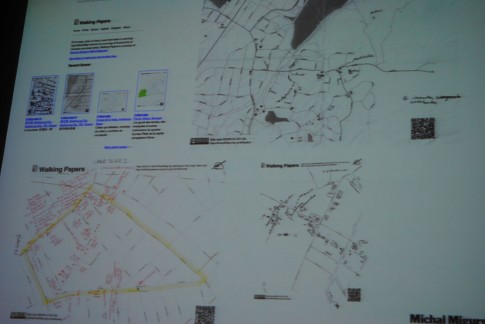
Kate introduced eight of the projects that will be featured in the exhibition catalog. One of these projects, Walking Papers by Michal Migurski of Stamen Design, is a website that offers a way to “round trip” map data through paper, to make it easier to perform eyes-on-the-street edits. Requiring minimal technology, the project allows users to print out an area, take to the street, and map out that area. Then, users scan it in and trace their findings. Walking Papers was recently used in the Haiti relief efforts to map and share real geographic data of stricken areas.
Additional projects discussed were Nicholas Felton’s 2009 Feltron Annual Report, Chromaroma, Locals and Tourists, BBC Dimensions, They Rule, Walk the Solar System, and E.Chromi. Kate concluded her presentation by saying that MoMA is collecting visualizations and exhibiting them, looking at continuing shifts.
The upcoming Talk to Me exhibition, opening on July 24 2011, will offer a snapshot of visualizations at this moment in time, a snapshot that will be finished by the public.
The Scholastic
Laura Kurgan, co-director SIDL (Spatial Information Design Lab), Columbia University.
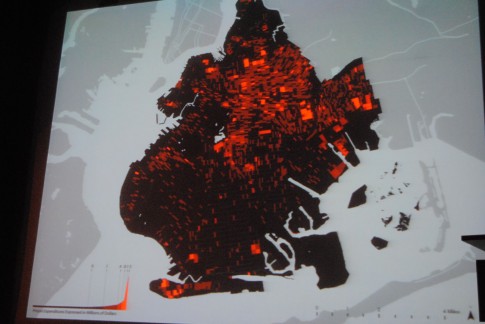
Laura detailed three projects. One of the profiled projects was Million Dollar Block, a collaboration with the United States Department of Justice that has been on-going for the past five years. The project began with a data set collected by the courts as people are incarcerated.
The system tracks people through the prison system and maps the home address of these individuals. The name, “million dollar blocks,” was derived from an observation that addresses were more concentrated in poor neighborhood across the city.
In the data visualizations, users can see the amount of money it costs to incarcerate people from these blocks. The project has been has been produced as an online database in other states across the country.
Laura also discussed the projects Scales of Green, and Native Land: Exits part 1 and 2.
The Professional
Lisa Straussfield, interaction designer and partner at Pentagram.
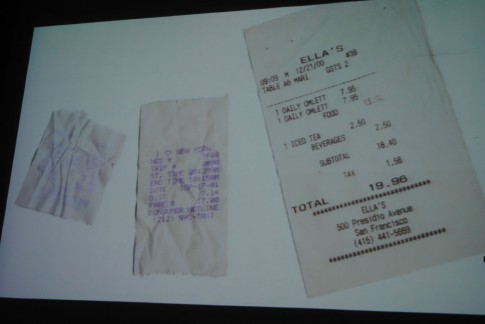
Lisa’s opening words were “I Love Data,” her first slide showed receipts she collects, emphasizing the capture of emotional data.
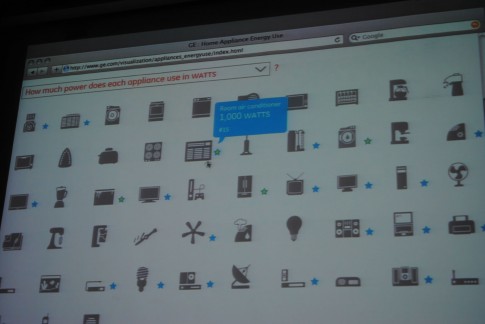
Lisa discussed projects including Quokka Sports in the 90’s, and a portfolio site for the architecture firm DS&R. She shared examples of data visualizations completed for GE that “advance the conversations that shape our lives”.
One of the examples collected data on appliances, and used a calculator to understand units of energy consumption. It converted energy consumption of appliances to dollars; a way to re-frame information in order to better understand it.
Lisa concluded with an outlook for the future, stating 2011 is the time for this field. “Data is out there, available and waiting, and there are many stories to be told,” she said, “my best work lies ahead.”
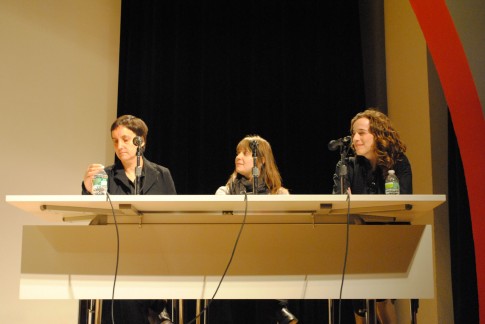
The evening ended with a Q&A involving the three speakers.
For more information, visit
MoMA Talk to Me Exhibition
Nicholas Felton’s 2009 Feltron Annual Report
Chromaroma
Walking Papers
Locals and Tourists
BBC Dimensions
They Rule
Walk the Solar System
E.Chromi
Native Land
DS&R
GE Data Visualization
To view event details, visit
AIGA/NY Data Visualization: Methods and Madness
http://2006.aigany.org/events/details/11P4/
To view additional photos, please visit our Flickr photostream. We encourage our members to contribute their photos to the AIGA New York Flickr group.